Hey guys! Its J to the E-E-E-N-G, haha, your scribe for today.
So our class started off by Trig Modeling. First we looked at a word problem it was a picture of a mountain that was reflecting on the water. We also talked about the sunrise at Saskatchewan, can you believe that they have no daylight saving time? There were also five questions that came along with it. After looking at the picture we saw a lot of transformation. For example the reflection, compression because of the smaller mountain, or should I say a hill, on the back of the mountain. Someone said that they saw the absolute value of the sine function. Mr. K said that he would call it a linear function. We're going to spend quite some time on problem solving. Friday's class would be just the introduction to Trig modeling and on monday we'll do more problem solving, it would take about two classes. We've learned about translation, compression, reflection, invereses, reciprocal and absolute values and they can all be mix together to find a function. The pretest would either be on monday afternoon or tuesday morning, that would be the latest. The test should be either on tuesday afternoon or wednesday morning. Don't forget to do B.O.B.
Then later on Mr. K talked talked to us about our photo assignment about real life math clipart. Our first assignment is called trigonometry, we have to find pictures somewhere out in the world that has to do with trigonometry. But there is an exception we cannot take pictures of peoples faces and take pictures from the internet, we have to take it ourselves using digital cam or cellphones. Mr. K showed us the rubric from last year, it was made by a group of people not just him. I believe Mr. K wants us to take a look at the rubric and if we have any suggestions or changes feel free to add or edit it your welcome to change anything on the document. I'm pretty sure Mr. K will put up the link pretty soon.
After we talked about our place in the blogsphere and he showed us how to find out about it. We also went to one of our young visitors Eddie, he's a grade five student in Georgia. I believe Mr. K said something about him being in a grade ten level, impressive much?. Seven days ago he looked at our blog and blogged about it. We read it and everybody was impressed of Eddie. From what I can remember when I was in grade five I didn't even know what a computer is! He's so interested learning about Pi and Phi's. Everybody had different reactions when we read the part when he said he can't wait to get in highschool. Wow, Eddie your awesome. You are very inspiring. I wish I had the same attitude as you when I was in your age. Hey, you should listen to our podcast sometime for our class on Friday, March 2, 2007.
We finished everything off with a few more introductory about trigonometric modeling. We also finished some of the questions Mr. K had for the beggining of the class we did the best we could but we ran out of time so we'll finish it off on monday. Well, that's pretty much it. Sorry it was kind of late. Well have a great weekend everybody.
oh btw the next scribe is : ALBERT M
Sunday, March 4, 2007


Friday, March 2, 2007
It's All In Your Hands!
 Go to flickr.com. Sign up for a free account. Get 5 pictures into your account ASAP, but remember, do not use your last name and no pictures of people's faces.
This picture shows that 7 x 7 = 49 ... click on it to find out how. ;-)
Cheers!
Mr. K.
Wow the world of blogging
I say this for all my classmates, that we were astonished and inspired to learn that a grade 5 student could make such a great blog. This is for Eddie in Georgia.
Leave him a comment just to show how him what you think of his blogger skills and finesse
http://itc.blogs.com/mind2/
Leave him a comment just to show how him what you think of his blogger skills and finesse
http://itc.blogs.com/mind2/
Thursday, March 1, 2007
BOB?
Wow, so math has been going at a mighty fast pace right from the beginning. Luckily I haven't had many obstacles that I couldn't get over so far. With the arrival of the smart board (and it's many technical difficulties) are class has become even more fast paced in terms of dictionary notes and one heck of alot more fun! In terms of the test(which i know has already taken place for most) I have no idea what to expect and are alittle scared from past experience. So wish me luck guys!
Plotting Piece Functions (is that how you call it?) on Fooplot
Yes, plotting piece functions or whatever you may call it (I forgot haha) works on Fooplot. The thing is, it makes those "weird" lines so I still have to play around with it. A problem that I found with it is that it doesn't accept greater/less than or equal to signs (≤, ≥), apparently it causes syntax error. Haha.
Graphing f(x) = {x2-4; x ≤ 0, x-8, x>0}:

Graphing: f(x) = { -3; -7 ≤ x ≤ -4, x + 1; -4 < x ≤ 3, 4; 3 < x ≤ 7 }

Note: As you can see, it makes those weirdthingy lines that it's not supposed to.. I'll find a way around it. Or maybe someone else will.
Also, a reminder to Mr. K, please put up our Math Dictionary notes. Haha.
Graphing f(x) = {x2-4; x ≤ 0, x-8, x>0}:

Graphing: f(x) = { -3; -7 ≤ x ≤ -4, x + 1; -4 < x ≤ 3, 4; 3 < x ≤ 7 }

Note: As you can see, it makes those weirdthingy lines that it's not supposed to.. I'll find a way around it. Or maybe someone else will.
Also, a reminder to Mr. K, please put up our Math Dictionary notes. Haha.
Absolutely!
Hi ya'll! This is Jann and I'll be your scribe for today.
Morning Class:
We had a quiz on transformations. We went over the answers like we always do. Then, we started a lesson on Graphing Absolute Functions.
There are 2 easy steps used to graph an absolute function.
Step 1: Sketch the graph of y = f(x).
Step 2: Reflect all the parts of the graph below the x-axis over the x-axis.
Here's an example:
The Black graph is the graph of y = x. The absolute value changes the negative output of the graph into a positive output. Where x<0, the negative outputs were changed to positive outputs.
Then, we looked at the graph of y=abs(2-x). According to our steps, we need to graph y = 2-x first. Then, we reflected the negative inputs of this graph towards the x-axis to make them positive; as shown by the red graph.
That's all we did for the morning class.
Afternoon Class:
We looked at this graph:
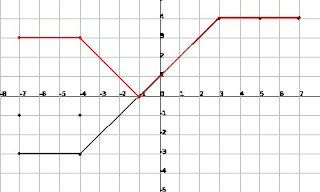 This graph has a function:
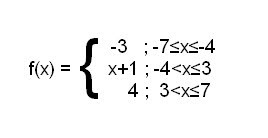 The Red graph shows the absolute value of the function. The black graph shows the original function.
Mr. K showed us how to graph this in our calculator. After researching and testing, (yay!) We were able to find the syntax to graph this in our calculator. Here's a small step-by-step procedure on how to graph this piecework:
Step 1: Press [Y=]
Step 2: Enter this syntax in "Y1"...
Y1 = (-3)(-7≤x)(x≤-4)+(x+1)(-4≤x)(x≤3)+(4)(3≤x)(x≤7)
Step 3: If there are "funky-looking" lines in your graph, press [Mode] then change "Connected" to "Dot". Press [Mode] again, then change it back to "Connected".
Mr. K also showed us how to graph the absolute value of this function. Here are the steps:
Step 1: Go back to the syntax entered in [Y1].
Step 2: Press [2nd] [Del] for "Insert".
Step 3: Press [MATH], then press [->] to go to "NUM".
Step 4: Press [1] for the "abs(" command.
Step 5: Place the cursor to the end of the syntax, then press [ ) ].
Your [Y1] should look something like this...
abs((-3)(-7≤x)(x≤-4)+(x+1)(-4≤x)(x≤3)+(4)(3≤x)(x≤7))
Then ♫TA-DA♫! Wicked awesome cool eh?
Then we looked at the graph of f(x) = abs(x^2-4)...
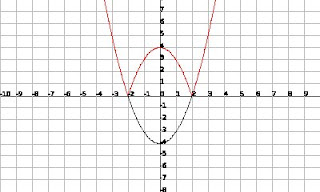 The part of the graph that is located below the x-axis was reflected along the x-axis.
Note: Watch out for the concavity (opens up or down) when graphing. We need to make sure the concavities of the graphs are properly drawn.
Then, we did a little bit of review regarding the Reciprocal Functions.
1. Given y = f(x), sketch the graph of y = 1/f(x).
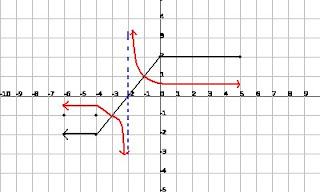 According to our rules, first find the "Invariant Points". Then, we find the asymptote(s), where the original graph has a root. Then we play the "Smallering & Biggering Game".
Finally, we looked at the reciprocal graph of f(x) = 2sinx...
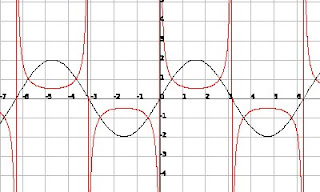 If you got the graph of 1/(sin(x)), the invariant points are connected to the minimums and maximums of the graph. In this case, the graph of 2sin(x) stretches the graph 2 units. The asymptotes are located at k"pi".
That's all we did today! This post should have been posted earlier, but I had a few disturbances.
Oh yeah! JENG is the next scribe.☺
Morning Class:
We had a quiz on transformations. We went over the answers like we always do. Then, we started a lesson on Graphing Absolute Functions.
There are 2 easy steps used to graph an absolute function.
Step 1: Sketch the graph of y = f(x).
Step 2: Reflect all the parts of the graph below the x-axis over the x-axis.
Here's an example:

The Black graph is the graph of y = x. The absolute value changes the negative output of the graph into a positive output. Where x<0, the negative outputs were changed to positive outputs.
Then, we looked at the graph of y=abs(2-x).
 According to our steps, we need to graph y = 2-x first. Then, we reflected the negative inputs of this graph towards the x-axis to make them positive; as shown by the red graph.
That's all we did for the morning class.
Afternoon Class:
We looked at this graph:
 This graph has a function:
 The Red graph shows the absolute value of the function. The black graph shows the original function.
Mr. K showed us how to graph this in our calculator. After researching and testing, (yay!) We were able to find the syntax to graph this in our calculator. Here's a small step-by-step procedure on how to graph this piecework:
Step 1: Press [Y=]
Step 2: Enter this syntax in "Y1"...
Y1 = (-3)(-7≤x)(x≤-4)+(x+1)(-4≤x)(x≤3)+(4)(3≤x)(x≤7)
Step 3: If there are "funky-looking" lines in your graph, press [Mode] then change "Connected" to "Dot". Press [Mode] again, then change it back to "Connected".
Mr. K also showed us how to graph the absolute value of this function. Here are the steps:
Step 1: Go back to the syntax entered in [Y1].
Step 2: Press [2nd] [Del] for "Insert".
Step 3: Press [MATH], then press [->] to go to "NUM".
Step 4: Press [1] for the "abs(" command.
Step 5: Place the cursor to the end of the syntax, then press [ ) ].
Your [Y1] should look something like this...
abs((-3)(-7≤x)(x≤-4)+(x+1)(-4≤x)(x≤3)+(4)(3≤x)(x≤7))
Then ♫TA-DA♫! Wicked awesome cool eh?
Then we looked at the graph of f(x) = abs(x^2-4)...
 The part of the graph that is located below the x-axis was reflected along the x-axis.
Note: Watch out for the concavity (opens up or down) when graphing. We need to make sure the concavities of the graphs are properly drawn.
Then, we did a little bit of review regarding the Reciprocal Functions.
1. Given y = f(x), sketch the graph of y = 1/f(x).
 According to our rules, first find the "Invariant Points". Then, we find the asymptote(s), where the original graph has a root. Then we play the "Smallering & Biggering Game".
Finally, we looked at the reciprocal graph of f(x) = 2sinx...
 If you got the graph of 1/(sin(x)), the invariant points are connected to the minimums and maximums of the graph. In this case, the graph of 2sin(x) stretches the graph 2 units. The asymptotes are located at k"pi".
That's all we did today! This post should have been posted earlier, but I had a few disturbances.
Oh yeah! JENG is the next scribe.☺
Today's Slides: March 1
Here they are ...
To see a larger image of the slides go here. When you get there you'll see a button in the bottom right-hand corner that says [full]. Click it and the slides will display in full screen mode.
To see a larger image of the slides go here. When you get there you'll see a button in the bottom right-hand corner that says [full]. Click it and the slides will display in full screen mode.
Subscribe to:
Posts (Atom)


