Morning Class:
We had a quiz on transformations. We went over the answers like we always do. Then, we started a lesson on Graphing Absolute Functions.
There are 2 easy steps used to graph an absolute function.
Step 1: Sketch the graph of y = f(x).
Step 2: Reflect all the parts of the graph below the x-axis over the x-axis.
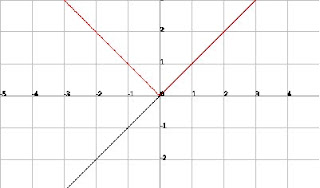
Here's an example:
.bmp)
The Black graph is the graph of y = x. The absolute value changes the negative output of the graph into a positive output. Where x<0, the negative outputs were changed to positive outputs.
Then, we looked at the graph of y=abs(2-x).
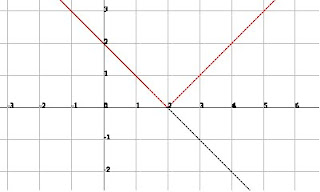.bmp) According to our steps, we need to graph y = 2-x first. Then, we reflected the negative inputs of this graph towards the x-axis to make them positive; as shown by the red graph.
According to our steps, we need to graph y = 2-x first. Then, we reflected the negative inputs of this graph towards the x-axis to make them positive; as shown by the red graph.That's all we did for the morning class.
Afternoon Class:
We looked at this graph:
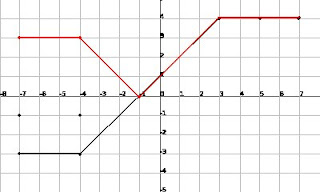 This graph has a function:
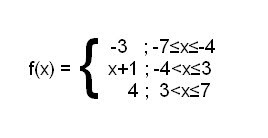 The Red graph shows the absolute value of the function. The black graph shows the original function.
Mr. K showed us how to graph this in our calculator. After researching and testing, (yay!) We were able to find the syntax to graph this in our calculator. Here's a small step-by-step procedure on how to graph this piecework:
Step 1: Press [Y=]
Step 2: Enter this syntax in "Y1"...
Y1 = (-3)(-7≤x)(x≤-4)+(x+1)(-4≤x)(x≤3)+(4)(3≤x)(x≤7)
Step 3: If there are "funky-looking" lines in your graph, press [Mode] then change "Connected" to "Dot". Press [Mode] again, then change it back to "Connected".
Mr. K also showed us how to graph the absolute value of this function. Here are the steps:
Step 1: Go back to the syntax entered in [Y1].
Step 2: Press [2nd] [Del] for "Insert".
Step 3: Press [MATH], then press [->] to go to "NUM".
Step 4: Press [1] for the "abs(" command.
Step 5: Place the cursor to the end of the syntax, then press [ ) ].
Your [Y1] should look something like this...
abs((-3)(-7≤x)(x≤-4)+(x+1)(-4≤x)(x≤3)+(4)(3≤x)(x≤7))
Then ♫TA-DA♫! Wicked awesome cool eh?
Then we looked at the graph of f(x) = abs(x^2-4)...
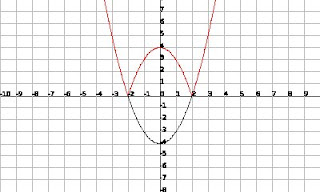 The part of the graph that is located below the x-axis was reflected along the x-axis.
Note: Watch out for the concavity (opens up or down) when graphing. We need to make sure the concavities of the graphs are properly drawn.
Then, we did a little bit of review regarding the Reciprocal Functions.
1. Given y = f(x), sketch the graph of y = 1/f(x).
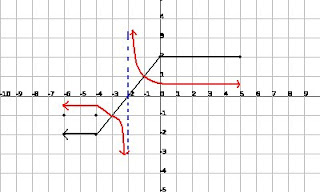 According to our rules, first find the "Invariant Points". Then, we find the asymptote(s), where the original graph has a root. Then we play the "Smallering & Biggering Game".
Finally, we looked at the reciprocal graph of f(x) = 2sinx...
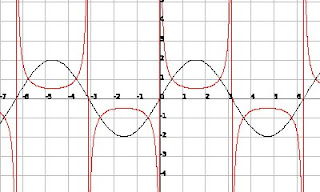 If you got the graph of 1/(sin(x)), the invariant points are connected to the minimums and maximums of the graph. In this case, the graph of 2sin(x) stretches the graph 2 units. The asymptotes are located at k"pi".
That's all we did today! This post should have been posted earlier, but I had a few disturbances.
Oh yeah! JENG is the next scribe.☺

6 comments:
Hey Jann, you mentioned, "The absolute value changes the negative input of the graph into a positive input. Where x<0, the negative inputs were changed into positive inputs." I thought it was the outputs or the y-values that become positive. Let's say it's y = |x| and we substitute -3 to x. Wouldn't y become 3 and not x since it's -3? So the new coordinates would be (-3,3). I may not be making any sense at all. But I thought I learned that it's the y-values that become positive on an aboslute value graph. Also if we look at y = |2x+4|. If x = -2, then y would be 2(-2) + 4 = 0, and not 2(2) + 4 = 8. I don't know if I make sense here but in the first solution, we substitute -2 for x and not |-2| for x. Therefore, it is the y values or OUTPUTS that turn into positive values on absolute value functions when they were negatives to begin with. I hope you get me and I'm not sure if I'm making sense. Tell me if I learned it wrong. Thanks!
Great post though! It's concise and comprehendable! It's just that one little area where I got perplexed.
Yes you're right Vince! Sorry about that, I guess I got carried away. XD Thanks for noticing the error. OUTPUTS are the ones changed to positive, not the inputs (x values).
I was right? WOW I really thought I didn't make any sense.
good job on the post..I like the detail you put into graphing those functions on the calculator...clever title as well =)
Great post and good eye Vincent
Post a Comment